As we mentioned in our last update we have been catching up on our backlog of mileage files: in total just over 200,000 mileage readings have been uploaded in the past week. As of 29th December 2010 the NMR contains 3,908,183 mileage records. We still have a quantity of small files to upload but we intend to get to those ASAP. I suspect that our January 2011 update will see us achieve another numeric milestone.
Average Mileage By Fuel Type
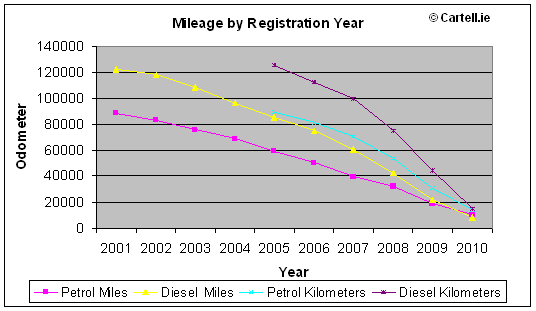
In an earlier article discussing average mileage in Ireland we referred to SEI figures indicating that diesel cars do more miles per year (14,799) than petrol cars (9,923) on average. However, we did not give the breakdown on fuel type. To provide this information we analysed NMR data from November and December 2010 and quantified average odometer readings in miles and kilometers for diesel and petrol cars separately. The results are shown in the following table.
| Year* | Petrol Miles | Diesel Miles | Petrol Kilometers** | Diesel Kilometers** |
|---|---|---|---|---|
| 2010 | 9970 | 8475 | 14135 | 14902 |
| 2009 | 18950 | 21783 | 30786 | 44639 |
| 2008 | 32214 | 42361 | 53705 | 75122 |
| 2007 | 39852 | 60755 | 71155 | 99908 |
| 2006 | 50607 | 75287 | 81463 | 112974 |
| 2005 | 59303 | 85419 | 89589 | 125529 |
| 2004 | 68661 | 96102 | – | – |
| 2003 | 75871 | 108704 | – | – |
| 2002 | 83068 | 117864 | – | – |
| 2001 | 89086 | 122052 | – | – |
Since a picture tells a thousand words, the following chart makes the data easier to visualise.
 Discussion
Extrapolating*** in a similar manner to the previous article we come up with an average figure of 10,232 miles for petrol cars and 13,610 miles per year for diesel cars.
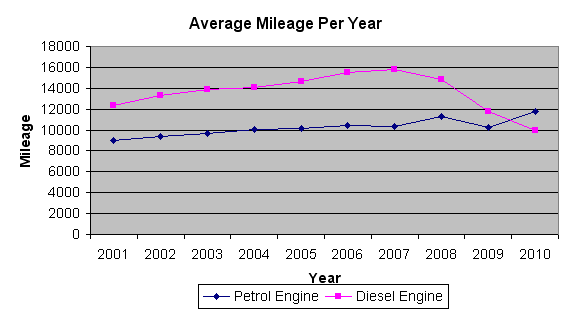
The figure for petrol cars 10,232 compares favourably with the SEI figure of 9,923, but our figure of 13,610 miles per year for diesel cars is almost 1,200 miles per year lower than we originally expected. The lower figure for average diesel mileage can be readily explained by the recent trend for motorists to choose diesel cars over petrol cars for taxation reasons. This lowering trend began in 2008 and is readily discernible from the NMR data, as the following graph shows.
 It is the data for vehicles registered after 2008 which reduces the overall average mileage for diesel cars in recent times. If we average pre-2008 vehicle data a figure of 14,213 miles per year is arrived at – much closer to the original SEI figure of 14,799 miles.
One interesting observation from this study is that apart from the recent diesel figures the graph above shows a clear drop in average mileage per year as cars get older; newer cars tend to do more miles per year than their older counterparts.
There is at least one more factor at play here: but I’ll leave that for the next mileage update!
Statistical Notes
*The data presented here derives from a snapshot of car mileage data from privately taxed vehicles and is only valid for the period of Nov/Dec 2010.
**Before 2005 only a minority of Irish vehicles displayed their odometers in kilometers, thus producing a much smaller sample. In the interests of statistical consistency this data has been omitted.
***As some data derives from sales mileage, we assumed:
- An average sales cycle of 3 weeks
- Most vehicles are initially registered Jan-March.
This allows us approximate that the sample 2010 data used above is 0.85 of a full years mileage.
| 10231.78 |


2 Comments
Does these results include mileage from NCT?
JW
Hi John,
The Register is always looking at new ways to obtain additional sources of mileage. One of these is the National Car Test (NCT) readings. Cartell has placed pressure on the Government to obtain these readings and will continue to do so. At the moment these readings are not available in bulk to anyone – we feel this should change.